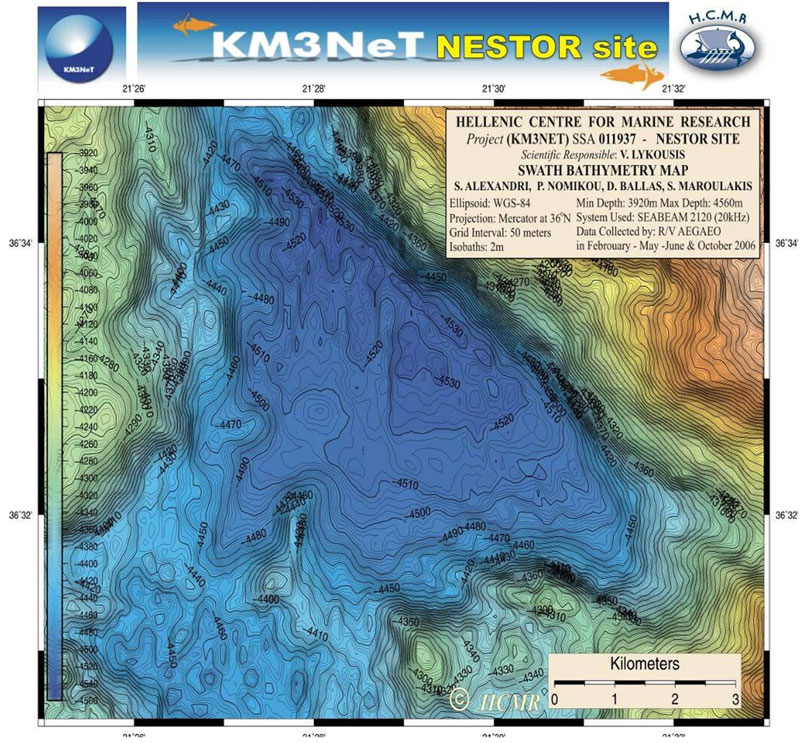
Detailed studies of the candidate sites in the NESTOR region in the East Ionian Sea near Pylos have been carried out using side-scan sonar1. The locations and the bathymetry of the candidate sites are shown in figure 1.1. The coordinates of the nearest point of the corresponding plateaus as well as the available sea bottom area at that depth are summarised in table 1.1. In figure 1.2 a typical detailed bathymetric map of the area NESTOR 4.5 (i.e. depth 4500m) is shown, with isobaths of 2m. Similar resolution charts are available for the whole NESTOR region. The sea bottom surface is flat and with very old sedimentation2.

click on the image for a better map
1 Hellenic Centre for Marine Research
2 E. Trimonis et al, “Geomorphology
and bottom sediments of the Pylos area”, Proceedings of the 2nd
NESTOR International Workshop, page 321, L. K. Resvanis editor (1992);
| Site code |
Nearest spot |
Max. depth m |
Nearest distance to |
Sea bottom area |
||||
|
shore |
Methoni or Pylos |
|||||||
| NM | km | NM | km | km2 | ||||
| N5.2 | 36° 33’N, 21°12’E | 5200 | 24.4 | 45.0 | M | 27.5 | 51.0 | >35 |
| N4.5 | 36° 33’N, 21°30’E | 4550 | 14.0 | 26.0 | M | 18.0 | 33.6 | >15 |
| N3.7 | 36° 38’N, 21°36’E | 3750 | 7.5 | 13.9 | M | 12.0 | 22.0 | >25 |
| N3.0 | 36° 50’N, 21°32’E | 3000 | 7.0 | 12.7 | P | 8.8 | 16.2 | >40 |
click the image to enlarge
The weather data, collected during several years at the NESTOR site area were analysed. In particular, data gathered by the National Meteorological Service of Greece for wind speeds from 1.1.1956 to 31.8.2002, taken at the Methoni Meteorological Station; 36° 49.5'N, 21° 42.3E'. Wind speeds were recorded every 8 hours. In the following graph (figure 2.1), a “day” is defined as any time period of 3 consecutive 8 hour data readings. It is interesting to note that almost 50% of the time is covered with four consecutive days with wind force equal or less that 4 beaufort (i.e. less than wind speed of 15 knots or 7.9m/s).
|
|
|
|
|
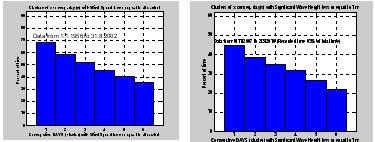
Moreover, in 2007, the
Hellenic Centre of Marine Research (HCMR) installed a Environmental Buoy
of the program "POSEIDON" of HCMR, in the PYLOS area, at 36° 50.2N, 21°
36.7E, which records, stores and transmits in real time a collection of
environmental data3 . In figure 2.2 the time percentage with
wave height less or equal to 1m (equivalent to sea state 4 beaufort) are
shown; here also a “day” is defined as any time period of 3 consecutive
8 hour data readings. Note that almost 35% of the time we have four
consecutive days with wave height less or equal to 1m.
In Figure 2.3 the surface currents are presented.
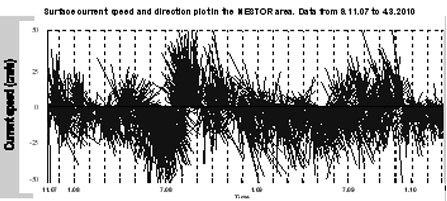
Figure 2.3: Surface current at the NESTOR area, POSEIDON data
3 POSEIDON Oceanographic data
management, Hellenic Centre of Marine Research,
www.poseidon.hcmr.gr.
Passero area.
- E.G. Anassontzis et al., “Water transparency measurements in the deep Ionian Sea”, Astroparticle Physics, Vol34, 187-197, 2010,
- E.G. Anassontzis et al.- “Light transmissivity in the NESTOR site”, Nuclear Instruments and Methods in Physics Research A 349(1994)242-246,
- S. A. Khanaev et al, “Measurements of Water transparency South-West of Greece”, Proceedings of the 2nd NESTOR International Workshop, page 253, L. K. Resvanis editor (1992),
Note the consistency of the results over twenty years.
Measurements of water
mass circulation have been performed since 19904. From
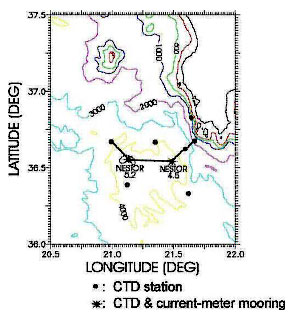
February 2006 to September 2009, ten research cruises have been
conducted in the NESTOR area in the Eastern margin of the Ionian Sea to
the southwest of Peloponnese (Figure 3.1). In most of these cruises
typical hydrographic work was carried out with collection of CTD
(conductivity, temperature, and depth) profiles at the stations shown in
Figure 3.2 in addition to long-term (3.5 year) tall mooring deployments
at stations NESTOR 4.5 (i.e. depth 4500m) and NESTOR 5.2 (i.e. depth
5200m), figure 1.1. In February 2006 the moorings were deployed in the
site NESTOR 4.5 and then at four levels of the water column of both
sites NESTOR 4.5 and NESTOR 5.2. Current-meter mooring measurements at
four levels at site NESTOR 4.5 were continued beyond September 2009. In
the following, an overview of the hydrographic and current meter results
for the period February 2006 to September 2009 are presented.
The techniques and instruments i.e. current meters and sediment traps
used in similar measurements in the Capo Passero and Toulon areas are
the same with those we have used in the Pylos area and therefore the
results are directly comparable.
 |
|
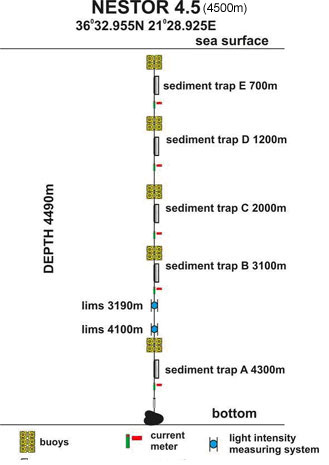
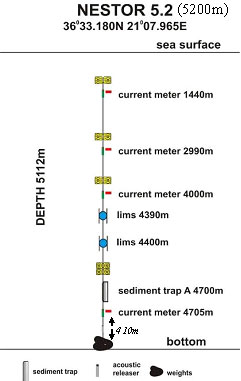
Figure 3.3 shows profiles of various hydrographic properties at site NESTOR 5.2 that were measured in May 2007. The basic deep water masses in the vertical column structure are also indicated on the respective figure. The light transmission refers to the percent red light intensity detected after transmission through the water at a distance of 25 cm relative to the intensity emitted from the light source at zero distance. The light forms a well-collimated beam and travels without spherical spreading. The two local maxima in salinity and temperature, one at ~ 1600 m and the other at ~3300 m, indicate two cores of water that originates in the Cretan Sea and thus is characterized by higher salinity and temperature. This mass (Cretan Dense Water) after its exit from the Cretan Straits equilibrates due to its density at the respective levels but can also undergo some vertical migration by the dynamic circulation structures (cyclones or anticyclones) in which it may be located as it spreads within the Eastern Mediterranean. At depths below ~3600 m, there is water of Adriatic origin as is indicated by the decreasing salinity and water transparency. As long as the dissolved oxygen values are increasing with depth, this Adriatic water is newly formed, i.e., it was recently at the surface and has been sub-ducted at those depths due to dense water formation during some recent winter. At depths greater than ~5000 m the oxygen values are decreasing and this is indicative of some isolated old Adriatic water mass that is found in the near bottom layers of the Vavylov Deep where site NESTOR 5.2 is located.
4 T. A. Demidova et al “Investigation of near bottom currents in mouse pit in the vicinity of NESTOR area”, Proceedings of the 2nd NESTOR International Workshop, page 284, L. K. Resvanis editor (1992)
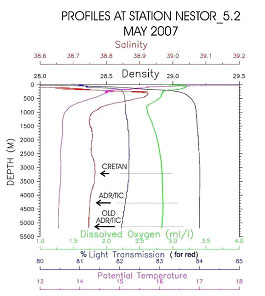
Figure 3.3. Salinity (red), potential temperature (purple), density (black), water transparency (blue) and dissolved oxygen (green) profiles at site NESTOR 5.2 (i.e. depth 5200m) in May 2007
Deep circulation –
currents
Figure 3.4 shows the deep dynamic height fields during October 2006,
April 2008 and May 2009. The flow at the deep layer 3200-3850 m is
cyclonic in October 2006 and April 2008, whereas it reverses into
anticyclonic (clockwise) in May 2009. We note, however, that the mean
flow field at depths greater than 4 km is cyclonic (counter-clockwise)
during all of the 2006-2009 period, as is shown in the directly measured
currents at sites NESTOR 4.5 (i.e. depth 4500m) and NESTOR 5.2 (i.e
depth 5200m) in Figures 3.5 and 3.6. The basic feature observed on
Figures 3.5 and 3.6 with respect to the site characterization for the
installation of the deep neutrino telescope, is that the deep flow field
at depths of 4.5 km and 5 km is characterized by extremely weak
velocities with mean speeds near ~2 cm/sec. This is also shown on the
histogram distributions of the current speeds in Figure 3.7.
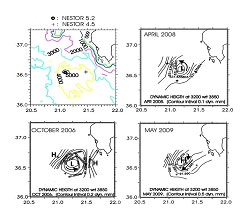
Figure 3.4. Dynamic height field anomalies at 3200 m with reference at 3850 m during October 2006, April 2008 and May 2009 showing the corresponding circulation structure with black arrows for the layer 3200-3850 m.
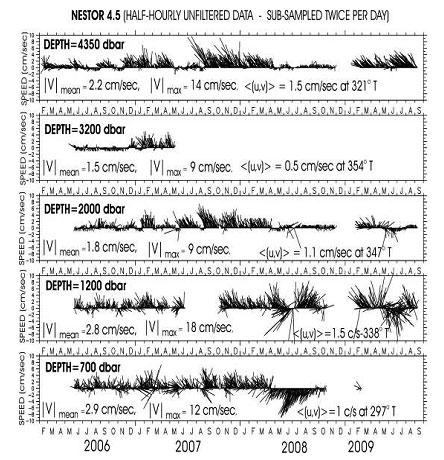
Figure 3.5. Vector stick time-series of currents at various depths of site NESTOR 4.5 (i.e. depth 4500m) and basic statistics on current speeds and mean vectors obtained on the half-hourly unfiltered data
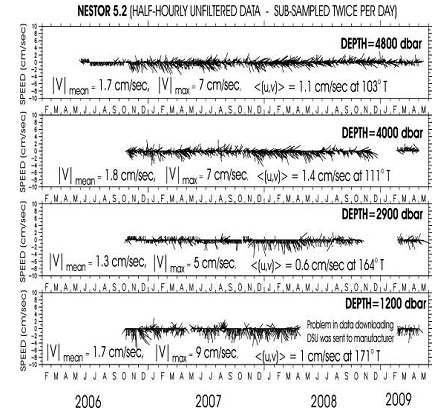
Figure 3.6 Vector stick time-series of currents at various depths of site NESTOR 5.2
(i.e. depth 5200m) and basic statistics on current speeds and mean vectors obtained on the half-hourly unfiltered data
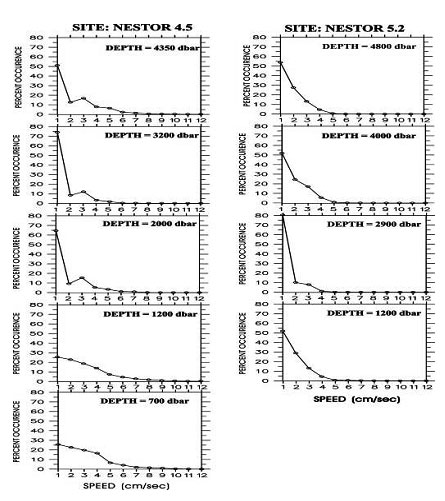
Figure 3.7 Histogram distributions of current speeds of half-hourly/unfiltered current data at sites NESTOR 4.5 (i.e. depth 4500m) and NESTOR 5.2 (i.e. depth 5200m)
4a. Settling particle fluxes: results from time series sediment trap measurements at the NESTOR site
4b. LIMS: Sedimentation measurements on to Optical Modules; LIMS, the "Light Intensity Measuring System"
4c. Geomorphology and bottom sediments of the Pylos area
4d. Long Term effects of fouling on glass, metal and plastics
4a. Settling particle fluxes: results from time series sediment trap measurements
at the NESTOR site ( February 18th 2006 to October 15th 2008)
In figure 4.1 we present
the available mass data flux from ANTARES,
NEMO and NESTOR
(KM3NeT CDR p61, KM3NeT TDR pp.123-125) .
The total mass flux and
the spatial variations at the NESTOR 4.5 and 5.2 sites have been
thoroughly investigated. Two sediment trap lines
were deployed in the area of NESTOR named NESTOR 5.2 (210 07.965E, 360
33.180N) and NESTOR 4.5 (210 28.925E, 360 32.955N) with one and five
sets of trap (TECHNICUP, with 12 receiving cups and 1/8m2 collecting
area) and current meter (AANDERAA RCM-11 and RCM-9) respectively (figure
4.2). In addition two Light Intensity Measuring Systems (LIMS) per line
were also deployed. Dates, mooring positions, bottom depths of the
mooring lines and the nominal depths of the instruments deployed in both
sites are given in Table 4.1. The traps were synchronized to collect
particles over 1 or 2-week periods. The experiment consisted of five
individual deployments covering the period from February 18th
2006 to October 15th 2008. Data have also been collected in
2009 but the analysis is not completed yet. Further, measurements are
continued to date.
The techniques and instruments i.e. current meters and sediment traps
used in similar measurements in the Capo Passero and Toulon areas are
the same with those we have used in the Pylos area and therefore the
results are directly comparable.
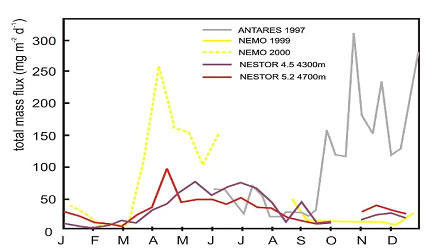
Figure 4.1. Monthly mass flux variations from ANTARES, NEMO and NESTOR sites. The NESTOR fluxes are the mean month fluxes for the entire period of the experiment (KM3NeT CDR p61, KM3NeT TDR pp.123-125) .
|
Table 4.1. Dates, site positions, bottom depths of the mooring lines and the nominal depths of the traps deployed in NESTOR area. Data collected in 2009 have not all been analysed yet |
||||||
|
SITE |
LONG |
LAT |
DEPTH (m) |
CURRENT METER |
TRAP NAME |
COLLECTING PERIOD |
|
|
||||||
|
NESTOR 4.5 sediment trap lines |
210 28.925 |
360 32.955 |
700 |
|
E |
1/11/06-15/10/08 |
|
705 |
X |
|
|
|||
|
1200 |
|
D |
3/6/06-15/10/08 |
|||
|
1205 |
X |
|
|
|||
|
2000 |
|
C |
3/6/06-15/10/08 |
|||
|
2005 |
X |
|
|
|||
|
3200 |
|
B |
3/6/06-15/10/08 |
|||
|
3203 |
X |
|
|
|||
|
4300 |
|
A |
18/2/06- 15/10/08 |
|||
|
4305 |
X |
|
|
|||
|
4490 |
Sea bottom depth |
|||||
|
|
||||||
|
NESTOR 5.2 sediment trap lines |
210 07.965 |
360 33.180 |
1430 |
X |
|
|
|
2975 |
X |
|
|
|||
|
3990 |
X |
|
|
|||
|
4700 |
|
A |
3/6/06 - 30/4/09 |
|||
|
4705 |
X |
|
|
|||
|
5112 |
Sea bottom depth |
|||||
|
Table 4.2. Time-weighted means of total mass fluxes in mg m-2 d-1 at NESTOR 4.5 and 5.2 sites |
||
|
SITE |
TRAP |
Time-weighted means of total mass fluxes |
|
NESTOR 4.5 |
700m |
50.00 |
|
1200m |
40.80 |
|
|
2000m |
40.50 |
|
|
3200m |
31.50 |
|
|
4300m |
33.60 |
|
|
|
||
|
NESTOR 5.2 |
4700m |
36.40 |
|
|
||||||||||
|
SITE |
TRAP (m) |
TMF |
ORG. MATTER |
CARBONATES |
Sibio |
LITHOGENIC |
||||
|
% |
Flux |
% |
Flux |
% |
Flux |
% |
Flux |
|||
|
|
||||||||||
|
NESTOR 4.5 |
700 |
- |
- |
- |
- |
- |
- |
- |
- |
- |
|
1200 |
13.22 |
8.40 |
1.11 |
28.83 |
3.81 |
8.89 |
1.17 |
53.89 |
7.12 |
|
|
2000 |
32.02 |
5.22 |
1.67 |
32.30 |
10.34 |
9.32 |
2.99 |
53.16 |
17.02 |
|
|
3200 |
37.52 |
4.69 |
1.76 |
31.48 |
11.80 |
9.70 |
3.64 |
54.14 |
20.31 |
|
|
4300 |
29.31 |
5.02 |
1.47 |
30.93 |
9.07 |
8.07 |
2.37 |
55.97 |
16.41 |
|
|
|
||||||||||
|
NESTOR 5.2 |
4700 |
22.89 |
5.54 |
1.36 |
28.80 |
7.21 |
9.82 |
2.25 |
55.83 |
12.78 |
Qualitative and quantitative results for the period June to October 2006 are given in table 4.3. The lithogenic component was the major constituent of settling particles as the content was always higher than 50% at all depths (table 4.3 and figure 4.3). Carbonates (mainly coccoliths, Emiliania Huxley) were the dominant biogenic factor. The analogous chemical composition particulate matter caught by all traps confirms the same origin of those particles. Fluxes of organic matter never exceed the 2 mg m-2 d-1 increasing from 1200m to 3200m and then decreasing down to 4300m. Chemical composition and fluxes at the near sea bed traps of NESTOR 4.5 (i.e. depth 4500m) and NESTOR 5.2 (i.e. depth 5200m) are almost alike.
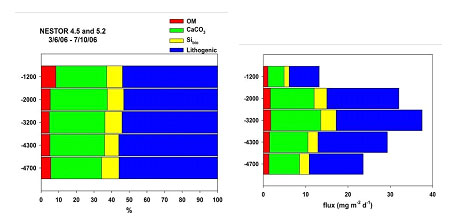
Figure 4.3. Chemical composition of particulate matter (left plot) and fluxes of major constituents (right plot) during the summer deployment (3/6/06 – 7/10/06).
5 ADIOS, Atmospheric Deposition and Impact on the Open Mediterranean Sea, http://forecast.uoa.gr/adios/index.html
6 SESAME, Southern Europe Seas: Assessing and Modeling Ecosystem changes, http://www.sesame-ip.eu
7 If the sampling interval is not constant, then it is also necessary to weight individual samples by the corresponding sampling duration to obtain a flux and time-weighted content: Cftw=ΣCiFiTi /ΣFiTi, where Cftw is the flux-weighted content for a given element, Ci and Fi the measured content and mass flux for sample I and Ti is the sampling duration of sample i.
In the South
Ionian four different sediment trap experiments have measured
particulate fluxes over the past ten years; in Capo Passero site, the
ADIOS site, the SESAME site and the NESTOR sites. In ADIOS, SESAME and
Capo Passero sites mass flux peaks similarly in April – May.
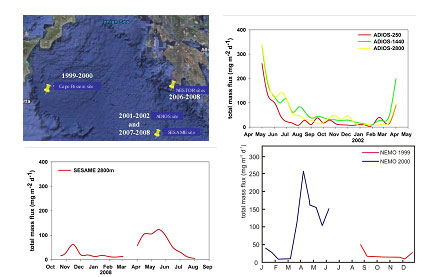
Figure 4.4. Locations of trap lines in S. Ionian Sea (up left). Mass flux temporal variations in Capo Passero site (up right), from ADIOS project 2001-2002 (down left plot) and SESAME project 2007-2008 (down right plot). The moorings of ADIOS and SESAME experiments were located at the same position. (Data from ADIOS and SESAME project are unpublished.)
In the NESTOR site the
situation is more complicated, and the flux maxima occurred from March
to August/September. Those periodical appearances of maxima, almost in
all depths, probably due to periodical phenomena such as Aeolian
transport and deposition of Sahara dust and the biological productivity.
In February and October 2006 CTD measurements recorded benthic nepheloid
layers detached from the shelf break that created intermediate nepheloid
layers, while in June and October of 2006 a benthic nepheloid layer was
observed in the NESTOR study area. That mechanism could transfer
materials (mainly lithogenic particles) to the deep sea. Taking into
account that the periods of high fluxes matches with the periods of
low rainfall (figure 4.2), and the lack of remarkable riverine
discharges from the adjacent land, that could transfer terrestrial
material in the NESTOR site, means that the NESTOR site hardly receives
any material directly from the mainland.
The similar ecological condition that prevails in the region can explain
the similar seasonal dependence recorded at all sites in South Ionian
Sea (figure 4.2 and 4.4). The slight decrease of mass flux with depth
means that NESTOR shows an “oceanic flux pattern”, while in figure 4.5
the mean mass flux in the South Ionian Sea versus depth is shown. The
mass flux measurements obtained from those experiments shown an eastward
gradual decrease of total mass flux.
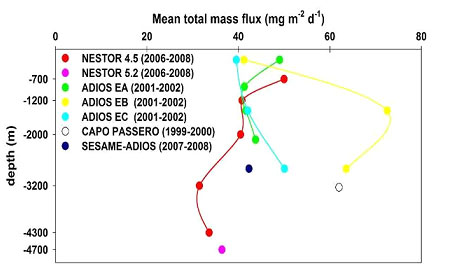
Figure 4.5. Mean mass flux in the S. Ionian Sea vs. depth.
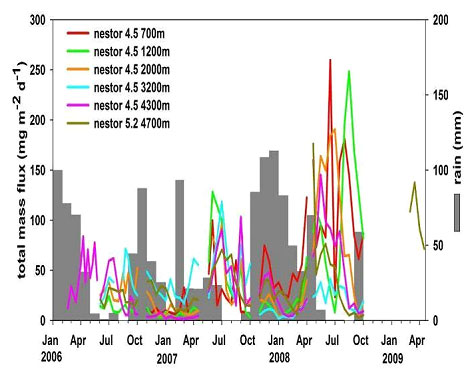
Figure 4.6. Total mass flux temporal and spatial variations at NESTOR 4.5 and 5.2 sites as well as rainfall (see RHS axis). Note that the abnormal increase in sediment during the Summer of 2008 is caused by the extreme forest fires in the Western Peloponnese and Messinia that Summer.
See also KM3NeT TDR p. 123
4b. LIMS: Sedimentation measurements on to Optical Modules; LIMS,
the "Light Intensity Measuring System"
We have built a large
number of autonomous systems, Light Intensity Measuring System (LIMS)9
, in order to measure the sedimentation which stays/stick on the optical
modules and/or bio-fouling effect on the Optical Modules (OMs) by
measuring light intensity variations on several positions on the glass
spheres deployed in the deep-sea over long time periods; 6-15 months. In
the course of over two years, May 2007 – Oct. 2009, 20 LIMS have been
deployed in the sites NESTOR4.5 and NESTOR5.2; a total 260 LIMS-months.
A grid of photosensors is distributed inside a glass sphere (BENTHOS or
VITROVEX) in the upper and lower hemisphere and measures the light
intensity of two light sources located outside the glass sphere. The
upper hemisphere is illuminated by the upper beacon, then it is switched
off, and the lower hemisphere is illuminated by the lower beacon, and
then switched off. This set of measurements is repeated every 3 hours.
The distribution of the photosensors inside the glass sphere is shown in
Fig.4b.1 and a Light Intensity Measuring System (LIMS) figure, ready for
deployment, is shown in Figure 4b.2.
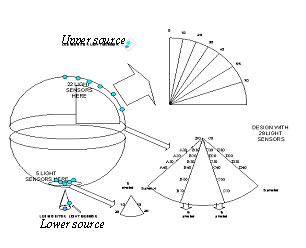
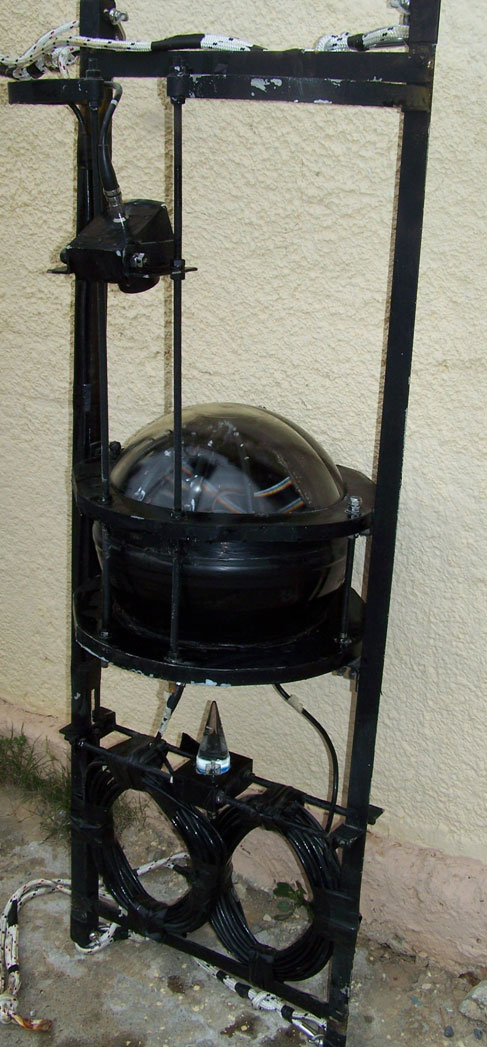
Figure 4b.2: Light Intensity Measuring System (LIMS) ready for deployment.
Each of the two light sources consists of an LED at 472nm wavelength,
coupled to a plexiglass casing with optical gel.
The photosensor (TAOS10, TSLB257), used inside the OM and
inside the beacons, is a light-to-voltage optical converter, containing
a photodiode and an operational-amplifier on a monolithic silicon IC.
The temperature in the sphere and the battery voltage are also monitored
[1].
Typical LIMS raw data are shown in figure 4b.3.
9
E.G.
Anassontzis et al., "A light intensity measuring system for sedimentation
measurements on KM3NeT optical modules", Nuclear Instruments and Methods
in Physics Research A 626-627(2011)111-114
10 Texas Advanced Optoelectronic Solutions,
www.taosinc.com
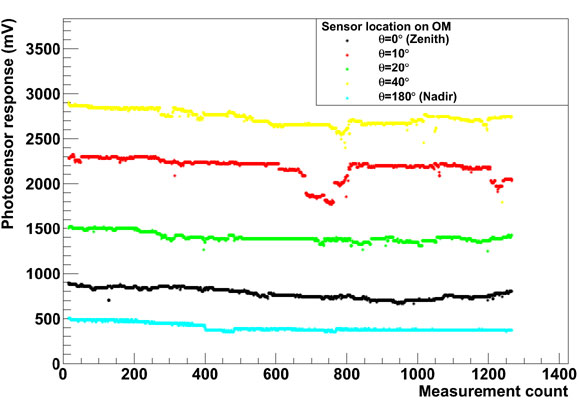
Fig. 4b.3. Typical LIMS raw data at various angles from Zenith and at Nadir of the glass sphere are shown; ( LIMS 210, site: NESTOR 4.5, depth: 3240m, data period: Oct.’07-Apr.’08).
The raw data of each
photosensor is averaged every nine consecutive measurements, normalised
by dividing with the average of the first five days since immersion and
corrected for source luminosity variations by multiplying the normalised
average of the corresponding reference photosensor.
Figure 4b.4a shows typical normalised averaged response of two
photosensors.
In order to determine a photosensor’s variation response during the
deployment period we compute the slope of the normalised averaged
response in constant time intervals of 60 hours. Such slopes are shown
in the histograms of figures 4b.4b and 4b.4c.
The Means of these histograms are plotted versus zenith angle in figure
4b.5 for a typical LIMS run of about 6 months duration.
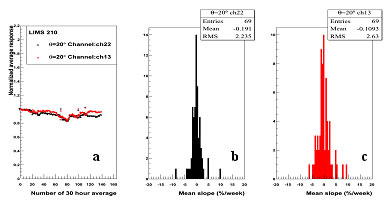
Figure 4b.4. Typical normalised averaged response of two photosensors (a) and the histograms of their corresponding slopes, (b, c); (LIMS 210, 2 channels at 20 degrees from Zenith, site: NESTOR4.5, depth: 3240m, data period: Oct.’07-Apr.’08).
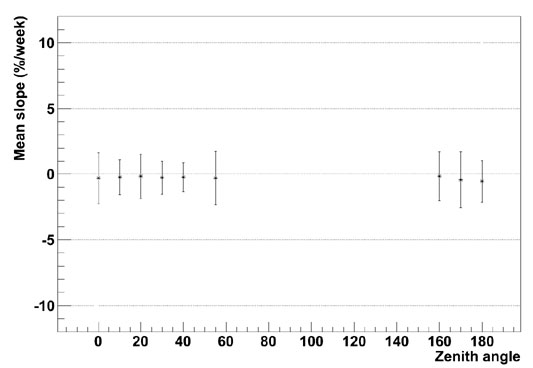
Figure 4b.5: The variation of the photosensors response is constant for the different positions on the glass sphere; (LIMS 210, site: NESTOR 4.5, depth: 3240m, data period: Oct.’07-Apr.’08).
The data for both the NESTOR 4.5 and 5.2
areas show that the probability that sediment will stick on the glass
sphere does not depend on the zenith angle. A more detailed description
of the instrument and the obtained results are published in
E.G.
Anassontzis et al., "A light intensity measuring system for
sedimentation measurements on KM3NeT optical modules", Nuclear
Instruments and Methods in Physics Research A 626-627(2011)111-114.
4c. Geomorphology and bottom sediments of the Pylos area
E. Trimonis et al, “Geomorphology and bottom sediments of the Pylos area” Proceedings of the 2nd NESTOR International Workshop, page 321, L. K. Resvanis editor (1992)
R/V METEOR expedition from 24 Jan to 6 Feb 2011
Figure 4c.2 Slides 15 and 19 from the presentation “New observations of life on the floor of the Ionian Sea” by Prof. I. Priede in the 2011 KM3NeT General meeting in Amsterdam (March 2011) with pictures of the seafloor surface at the NEMO and NESTOR 5.2 sites taken during the R/V METEOR expedition from 24 Jan to 6 Feb 2011
4d. Long Term effects of fouling on glass, metal and plastics .
We have not found any traces of fouling on the surfaces of the OMs, Ti-frames and the Al-cylinder of the LED capsule. One could see the presence of minor fouling on the surfaces of HARD-HATS (figure 4d.1). Thin traces of fouling could be seen on the polycarbonate dome of the main buoy flasher (figure 4d.2).
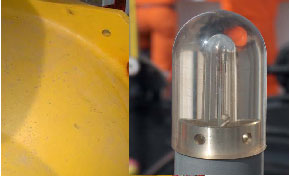
| Figure 4d.1 Hardhat with traces of fouling after 2.5 years at 4000m water depth | Figure 4d.2. Polycarbonate flasher dome with thin traces of fouling after 2.5 years at 4000m water depth |
2. Mechanical structure of the detector.
The Recovery Buoy came
to the surface in very good condition. The frame of the Recovery Buoy
was ordinary steel, painted with ordinary primer and protected with Zn
anode. The Zn-anodes protected the frame very well. The Al-housings of
the LEDs does not show any trace of corrosion since it was also
protected with Zn anodes.
The Ti-pipes of the arms did not have any corrosion. The welded joints
look very well without any caverns, cracks, holes. There are no
deformations along of arms. Some of the stainless steel washer used to
hold together the hardhats of the glass spheres were corroded (figure
4d.1).
3. Optical modules.
We have recovered 15
glass spheres: Four OMs each with PMT inside (two were oriented with the
photocathode looking down, figure 4d.3 and two with the photocathode
looking up, figure 4d.4) and eleven floatation spheres. Note that the
discolouring of the titanium frame is due to the pealing off of the
ordinary black paint we used to cover the titanium frame. None of the
glass spheres had any visual damage after being under 400 atm pressure
for 2.5 years. One only sphere lost a visible piece glass chip (about 5
cm in diameter and 1 mm at the maximum thickness) from the external
surface without any other structural damage. There was no sediment or
growth or any other fouling on the glass.
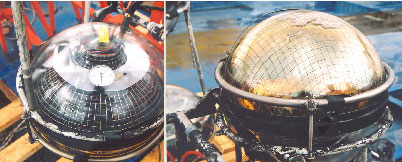
| Figure 4d.3. Optical Module after 2.5 years in 4000m water depth, the photocathode was looking down. | Figure 4d.4. Optical Module after 2.5 years in 4000m water depth, the photocathode was looking up. The whitish region on the top is a section where the silicon gel was unstuck when decompressed. The two brown blobs seen at 5 o'clock are the mirror reflections of two experimentalists. |
The GISMA connectors on
the OMs were opened easily. Neither water nor any other damage was found
inside the connectors. For the OMs, marine grade bronze connectors were
used. Their external surfaces had minimal corrosion. However, no
corrosion was found on the Ti-connectors used.
Conclusions
The effect of sedimentation, fouling and marine growth was studied with
three different ways (sediment traps, LIMS and long term exposure in the
deep sea) and they were found minimal, if any at all.
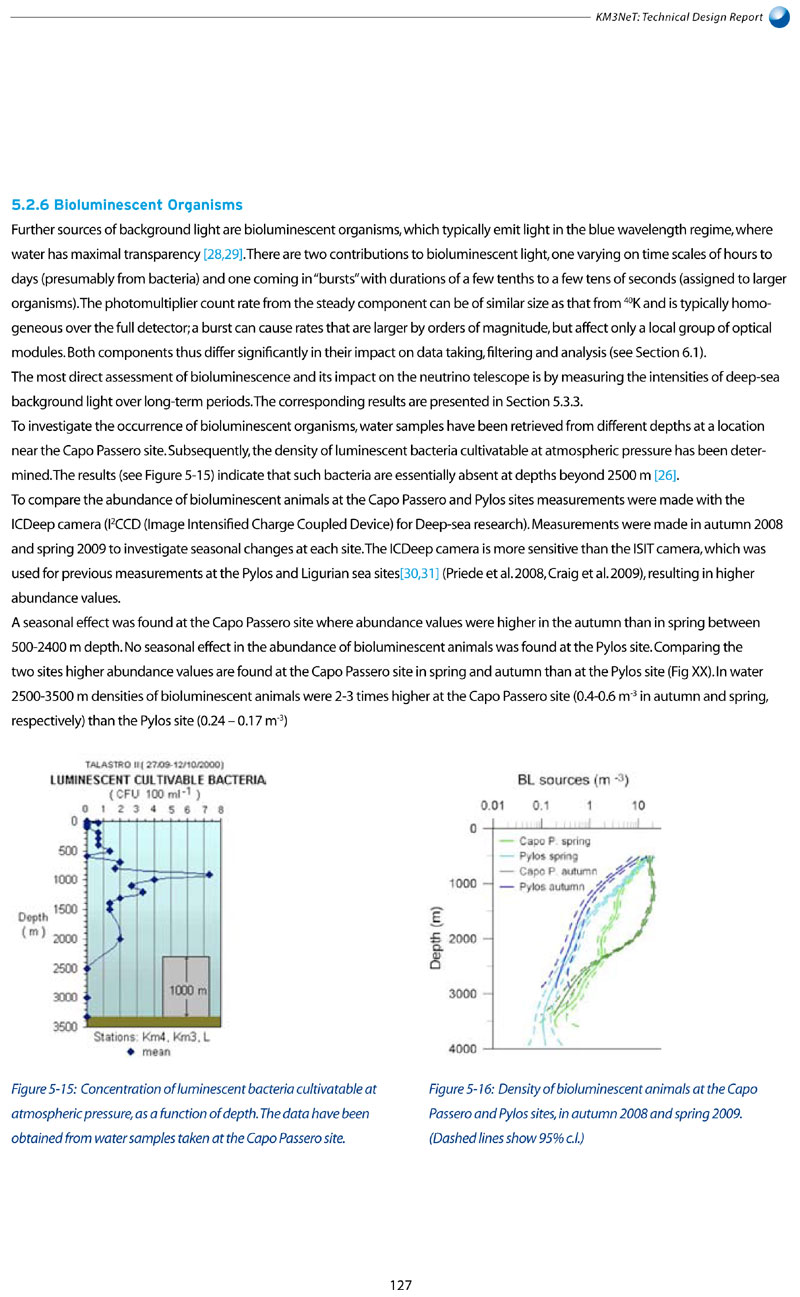
5a. Bioluminescence bursts (see also KM3NeT TDR p.133)
5b. Bioluminescence
We have been measuring the bioluminescence burst activity that saturates the optical module readout electronics since 1996. We have been measuring consistently 1.1% dead time (see KM3NeT CDR pp59-60, S. Sotiriou PhD thesis University of Athens, 1998 p. 258) with autonomous strings as well as with the detector prototype that was deployed in 2003. Further details can be found in the following paper by G. Aggouras et al; "Operation and performance of the NESTOR test detector" Nucl.Instr. & Methods in Phys. Res. Sect. A, 2005, Vol.: 552, Issue: 3, pp. 420-439 (see p.437).
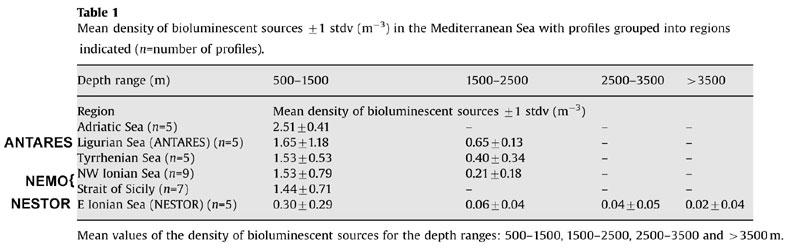
Compare our 1% dead time to the up to 40% dead time measured in one of the other two sites.
Further: We find it very instructive to reproduce Table 1 from the publication by Jessica Craig et al “Distribution of bioluminescent organisms in the Mediterranean Sea and predicted effects on a deep-sea neutrino telescope“ Nucl. Instr. & Methods in Phys. Res A 602 (2009) 224–226
Radiation activity in the NESTOR area has been investigated with water samples taken from various depths by the NESTOR Institute and were measured at the DEMOKRITOS National Lab. No significant radioactivity was found in the water column of the NESTOR sites. No technical radionuclei were found either.
|
TABLE 6.1 |
|||||
|
NUCLEI |
U‑234 |
U-238 |
Total U |
Cs-137 |
K-40 |
|
Activity units |
mBq/l |
mBq/l |
mg/l |
Bq/l |
Bq/l |
|
Activity |
27.2 ± 6.8 |
24.5 ± 6.2 |
2.0 ± 0.5 |
<0.05 |
14 ± 1 |